A 6-month analysis of 24,187 deliveries across Massachusetts, New Hampshire & Rhode Island
The Challenge: One-Size-Fits-All Pricing
Independent pharmacies across New England face a common challenge with their courier services: national logistics providers charge flat rates regardless of delivery distance. Whether a package travels 3 miles or 30 miles, the cost remains the same.
This pricing model exists because national couriers bundle packages from multiple clients in the same vehicle, averaging costs across their entire network. While this simplifies their operations, it creates a significant problem for pharmacies: those with concentrated local delivery patterns end up subsidizing long-haul capacity they rarely use.
The data shows that most pharmacy deliveries concentrate within local communities. When 50% or more of orders stay under 25 miles, flat-rate pricing results in overpayment of 20-30% compared to actual distribution costs.
Beyond Pricing: The Quality Problem
Cost is only part of the equation. National courier services often lack pharmacy-specific standards: packages left at wrong addresses, delivery instructions ignored, no signature verification, and limited support for non-English speaking patients. For pharmacies serving diverse communities, these gaps create real barriers to patient care.
The Solution: Tier-Based Pricing
New England Logistics developed a pricing structure aligned to actual pharmacy delivery patterns. Instead of arbitrary zones or flat fees, rates follow distance tiers that reflect real operational costs:
| Tier | Distance | Tier Distance Cost Driver |
|---|---|---|
| Tier 1 | 0-15 miles | Local routes - lowest operational cost, highest efficiency |
| Tier 2 | 15-25 miles | Regional coverage - moderate fuel and time investment |
| Tier 3 | 25-35 miles | Extended range - increased route planning required |
| Tier 4 | 35+ miles | Long-haul - highest cost, reserved for outlier deliveries |
This model rewards pharmacies for their natural delivery concentration. The more orders stay close to home, the more they benefit from lower-tier rates.
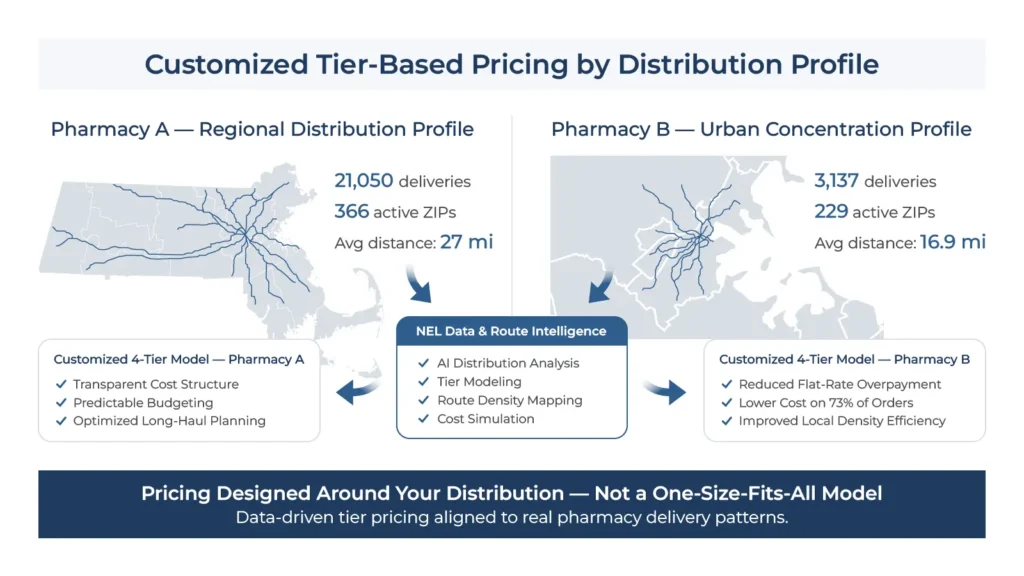
The Analysis: Two Pharmacy Profiles
To demonstrate the impact of tier-based pricing, we analyzed delivery data from two pharmacies with distinct distribution patterns over a 6-month period (January – June 2025).
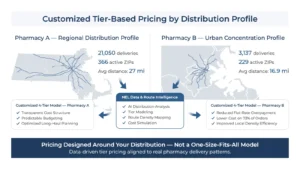
Pharmacy A: Regional Distribution Model
Pharmacy A operates a high-volume regional network spanning 321 cities across Massachusetts, New Hampshire, and Rhode Island. With 21,050 deliveries over 6 months, this pharmacy serves a broad geographic footprint.
| Total Orders | Avg/Month | Avg/Day | Active Zips | Avg Distance |
|---|---|---|---|---|
| 21,050 | 3,508 | 159 | 366 | 27.0 miles |
Distribution Pattern Analysis:
Pharmacy A’s deliveries distribute relatively evenly across all four distance tiers, reflecting their regional service model. The top 10 destination cities (Boston, Woburn, Burlington, Peabody, Billerica, Dorchester, Brookline, Lowell, Quincy, Cambridge) represent only 25% of total volume, indicating a widely dispersed patient base.
| Tier | 0-15 mi | 15-25 mi | 25-35 mi | 35+ mi |
|---|---|---|---|---|
| Orders | 4,143 | 5,406 | 5,768 | 5,733 |
| % of Total | 20% | 26% | 27% | 27% |
| Avg Distance | 9.9 mi | 19.9 m | 29.2 mi | 44.0 mi |
Key Finding: With only 46% of orders in Tiers 1-2, Pharmacy A’s distribution pattern means flat-rate pricing may be closer to actual costs.
However, tier-based pricing still provides full cost transparency and predictable rates – the pharmacy knows exactly what each delivery will cost based on destination.
Pharmacy B: Urban/Local Concentration Model
Pharmacy B serves a more concentrated urban market centered around Boston. With 3,137 deliveries across 191 cities, this pharmacy demonstrates a classic local-first distribution pattern ideal for tier-based pricing.
| Total Orders | Avg/Month | Avg/Day | Active Zips | Avg Distance |
|---|---|---|---|---|
| 3,137 | 523 | 24 | 229 | 16.9 miles |
Distribution Pattern Analysis:
Pharmacy B’s delivery pattern shows strong local concentration. The top 10 cities (Boston, Brockton, Dorchester, Quincy, Lawrence, Brookline, Somerville, Roxbury, Cambridge, Randolph) account for 37% of total volume. More significantly, destinations like Brookline average just 1.5 miles from the pharmacy, while Boston deliveries average only 4.1 miles.
| Tier | 0-15 mi | 15-25 mi | 25-35 mi | 35+ mi |
|---|---|---|---|---|
| Orders | 1,789 | 505 | 440 | 403 |
| % of Total | 57% | 16% | 14% | 13% |
| Avg Distance | 6.8 mi | 20.3 mi | 30.4 mi | 43.1 m |
Key Finding: With 73% of orders in Tiers 1-2 (under 25 miles) and 57% in Tier 1 alone (under 15 miles), Pharmacy B represents the ideal profile for tier-based pricing. Under a flat-rate model, this pharmacy would be subsidizing long-haul deliveries they rarely make.
The Results: Measurable Impact
Side-by-Side Comparison
| Metric | Pharmacy A | Pharmacy B |
|---|---|---|
| Total Orders (6 mo) | 21,050 | 3,137 |
| Average Distance | 27.0 miles | 16.9 miles |
| Orders in Tier 1 (0-15 mi) | 20% | 57% |
| Orders in Tiers 1-2 (0-25 mi) | 46% | 73% |
| Top 10 Cities Concentration | 25% | 37% |
| Q1 to Q2 Growth | +14.5% | +15.2% |
| Distribution Profile | Regional/Dispersed | Urban/Concentrated |
Cost Efficiency Analysis
The tier-based model delivers different value depending on delivery concentration:
| Tier 1 Concentration | 57% of all deliveries |
|---|---|
| Tier 1-2 Concentration | 73% of all deliveries |
| Estimated Savings vs Flat Rate | 15-20% |
| Primary Benefit | Direct cost reduction on majority of volume |
For Pharmacy A, the primary benefits are transparency and predictability rather than direct savings. With a more dispersed distribution, knowing exact costs per tier enables better budgeting and route optimization decisions
"Most pharmacies overpay 20-30% with flat rates when 50% of their orders stay under 25 miles. The question is: what does YOUR distribution actually look like?"
Growth Trajectory
Both pharmacies showed consistent growth from Q1 to Q2 2025, demonstrating the scalability of the tier-based model:
| Q1 (Jan-Mar) | Q2 (Apr-Jun) | Growth | |
|---|---|---|---|
| Pharmacy A | 9,813 orders | 11,237 orders | +14.5% |
| Pharmacy B | 1,458 orders | 1,679 orders | +15.2% |
Why Tier-Based Pricing Works
The analysis reveals a fundamental truth: pharmacy delivery patterns are not random. They follow predictable geographic concentrations based on patient populations, referral networks, and community demographics. A pricing model should reflect this reality.
The RX Delivery Approach: Three Pillars
1. Cost Transparency
Each delivery is priced according to actual distance traveled. No averaging across networks, no hidden subsidies. Pharmacies know exactly what each delivery costs before it ships, enabling accurate budgeting and informed decisions about service areas.
2. Dedicated Service
Unlike national couriers that combine packages from multiple clients, NEL assigns dedicated vehicles to each pharmacy. This ensures proper chain of custody, consistent handling standards, and accountability for every delivery. Packages are never mixed with other clients’ shipments.
3. Pharmacy-Trained Drivers
Our 75+ drivers receive pharmacy-specific training including patient communication protocols, proper identification verification, HIPAA compliance, and bilingual support (English/Spanish). Drivers understand they are an extension of the pharmacy’s patient care, not just package handlers.
Operational Standards
| Standard | Description |
|---|---|
| Real-Time Tracking | GPS visibility from pickup to delivery with timestamp verification |
| Digital POD | Photo proof of delivery with signature capture |
| Delivery Windows | Scheduled (SCH) and STAT service levels with SLA guarantees |
| KPI Monitoring | Driver performance tracked against efficiency and quality metrics |
| Route Optimization | Dynamic routing to minimize distance and maximize delivery density |
Conclusion
This analysis of 24,187 deliveries across two distinct pharmacy profiles demonstrates that tier-based pricing delivers measurable value – whether through direct cost savings (for locally-concentrated pharmacies like Pharmacy B) or through transparency and predictability (for regionally-dispersed pharmacies like Pharmacy A).
The key insight: understanding your actual delivery distribution is the first step toward optimizing logistics costs. Most pharmacies have never analyzed where their deliveries actually go.
Ready to Analyze Your Distribution?
Request a complimentary delivery analysis. We will map your distribution pattern, calculate tier breakdowns, and show you exactly how distance-based pricing could work for your pharmacy – with no obligation.
RX Delivery
Pharmaceutical Courier Services
Serving MA, NH, RI, VT, ME
www.rx-delivery.com
Data analyzed: January – June 2025 | 24,187 total deliveries | Pharmacy identities anonymized for confidentiality